
SUI Targets Bullish Breakout with Golden Cross Potential

SUI has gained some momentum in the last 24 hours, with its market cap now at $10.5 billion. However, it’s still trying to recover from a 26% decline over the past 30 days. Technical indicators currently show mixed signals. The CMF is at -0.06, reflecting easing selling pressure but still indicating cautious market sentiment.
Meanwhile, the Ichimoku Cloud suggests consolidation with the possibility of a bullish breakout. The EMA lines are showing early signs of a potential golden cross. If momentum continues, this could lead to a test of resistance at $3.73 and possibly a rise above $4.25.
SUI CMF Is Still Negative, But Showing Potential Recovery
SUI’s CMF is currently at -0.06, showing a notable recovery from -0.35 two days ago, although it has remained in negative territory for the past four days.
The rising CMF indicates that selling pressure is easing, suggesting that buying interest may be gradually returning. Despite this improvement, the negative value reflects that outflows are still outweighing inflows, indicating a cautious market sentiment.

This lingering negativity suggests that sellers still maintain some control of the SUI blockchain, but the upward movement hints at a potential shift in momentum if buying pressure continues to grow.
The Chaikin Money Flow (CMF) is a volume-based indicator that measures buying and selling pressure by analyzing price and volume data.
It ranges from -1 to +1, with positive values indicating buying pressure and negative values indicating selling pressure. Typically, a CMF above zero signals accumulation and bullish sentiment, while a CMF below zero indicates distribution and bearish sentiment.
With its CMF at -0.06, the market is still leaning bearish, but the recovery from -0.35 suggests that SUI selling pressure is weakening. If CMF can cross above zero, it could signal a bullish reversal. However, if it remains negative or turns downward again, it could indicate a continuation of the bearish trend.
SUI Ichimoku Cloud Shows Cautious Optimism
The Ichimoku Cloud for SUI shows a mixed outlook with signs of potential consolidation. The current cloud’s Leading Span A (green line) is above the Leading Span B (orange line), indicating a bullish sentiment for the near future.
However, the price is currently trading within the cloud, suggesting indecision and a lack of clear trend direction. When prices are within the cloud, it often signifies consolidation or a period of uncertainty, as neither buyers nor sellers have full control.
The green cloud ahead reflects slight bullish momentum, but its thinness suggests a weak trend that could easily be reversed.
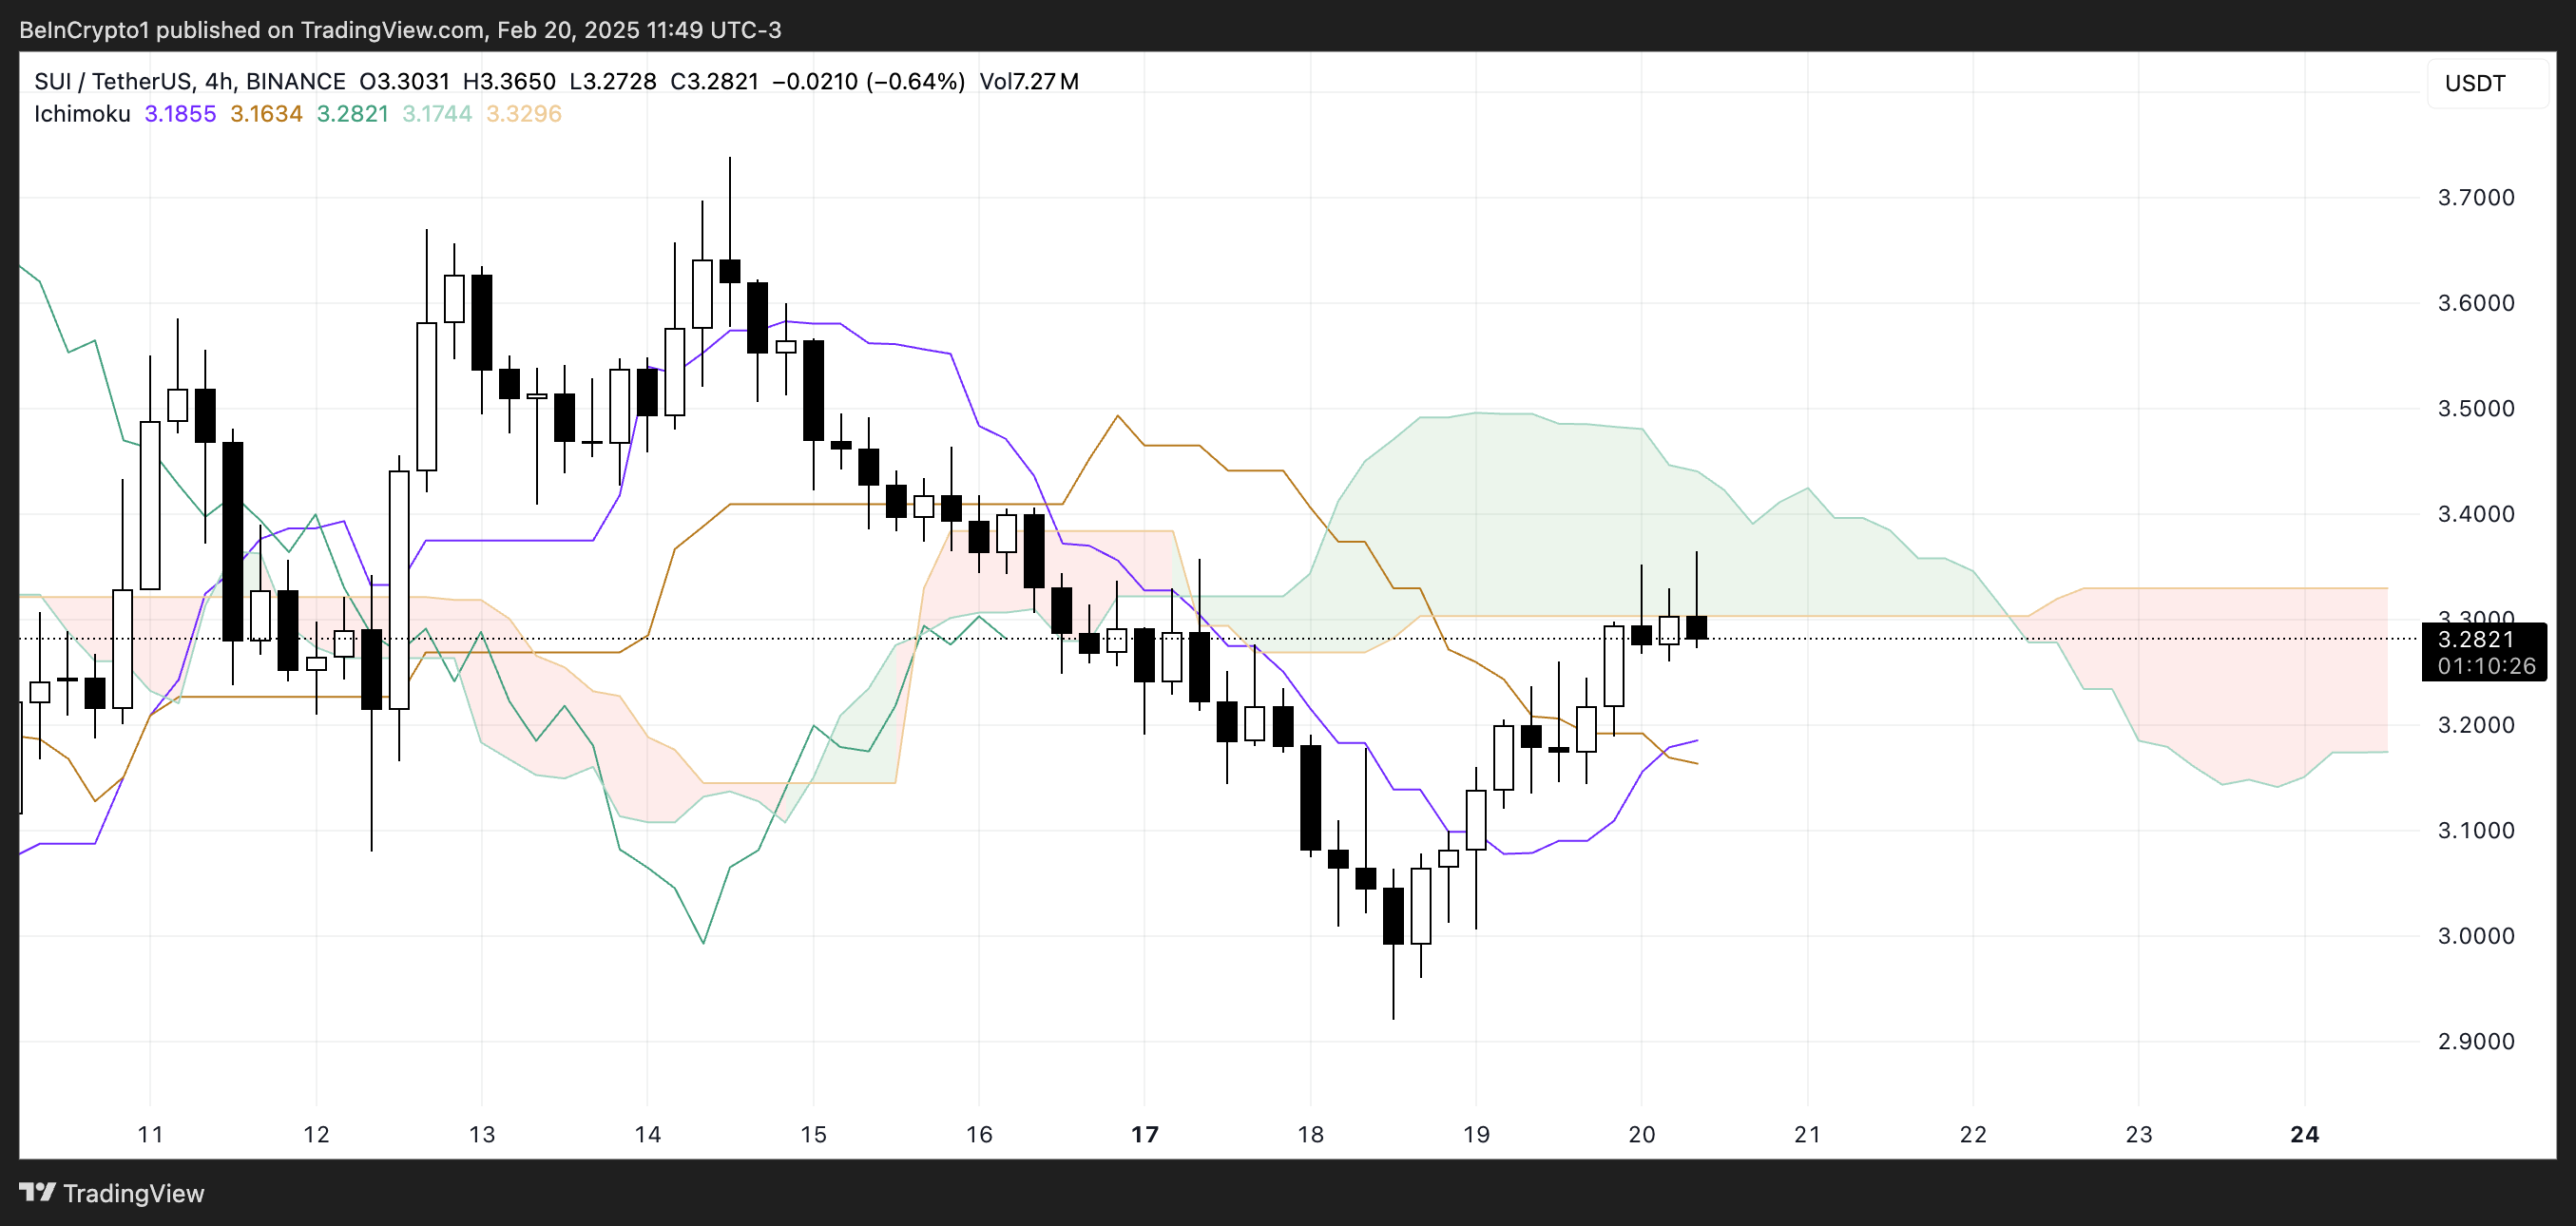
The purple Tenkan-sen line is below the orange Kijun-sen line, which typically signals bearish momentum. However, the gap between them is narrowing, suggesting a potential bullish crossover if SUI price continues to rise.
This crossover could indicate a shift in momentum toward the bulls. The Chikou Span (green line) is positioned above the price action, reinforcing the current bullish sentiment, but its close proximity to the candles suggests that momentum is not strong.
Overall, the Ichimoku setup shows cautious optimism, with the possibility of a bullish breakout if the price can move above the cloud. However, if it fails to do so and breaks below the cloud, bearish pressure could resume.
SUI Could Reclaim $4 Levels Soon
Although SUI price has been up in the last 24 hours, its EMA lines are currently in a bearish state, with short-term EMAs positioned below long-term EMAs. This alignment reflects a prevailing bearish trend, suggesting that sellers still maintain control.
However, the short-term EMAs are showing an upward trajectory, indicating a potential shift in momentum. If these short-term EMAs cross above the long-term ones, forming a golden cross, SUI could test the resistance at $3.73.
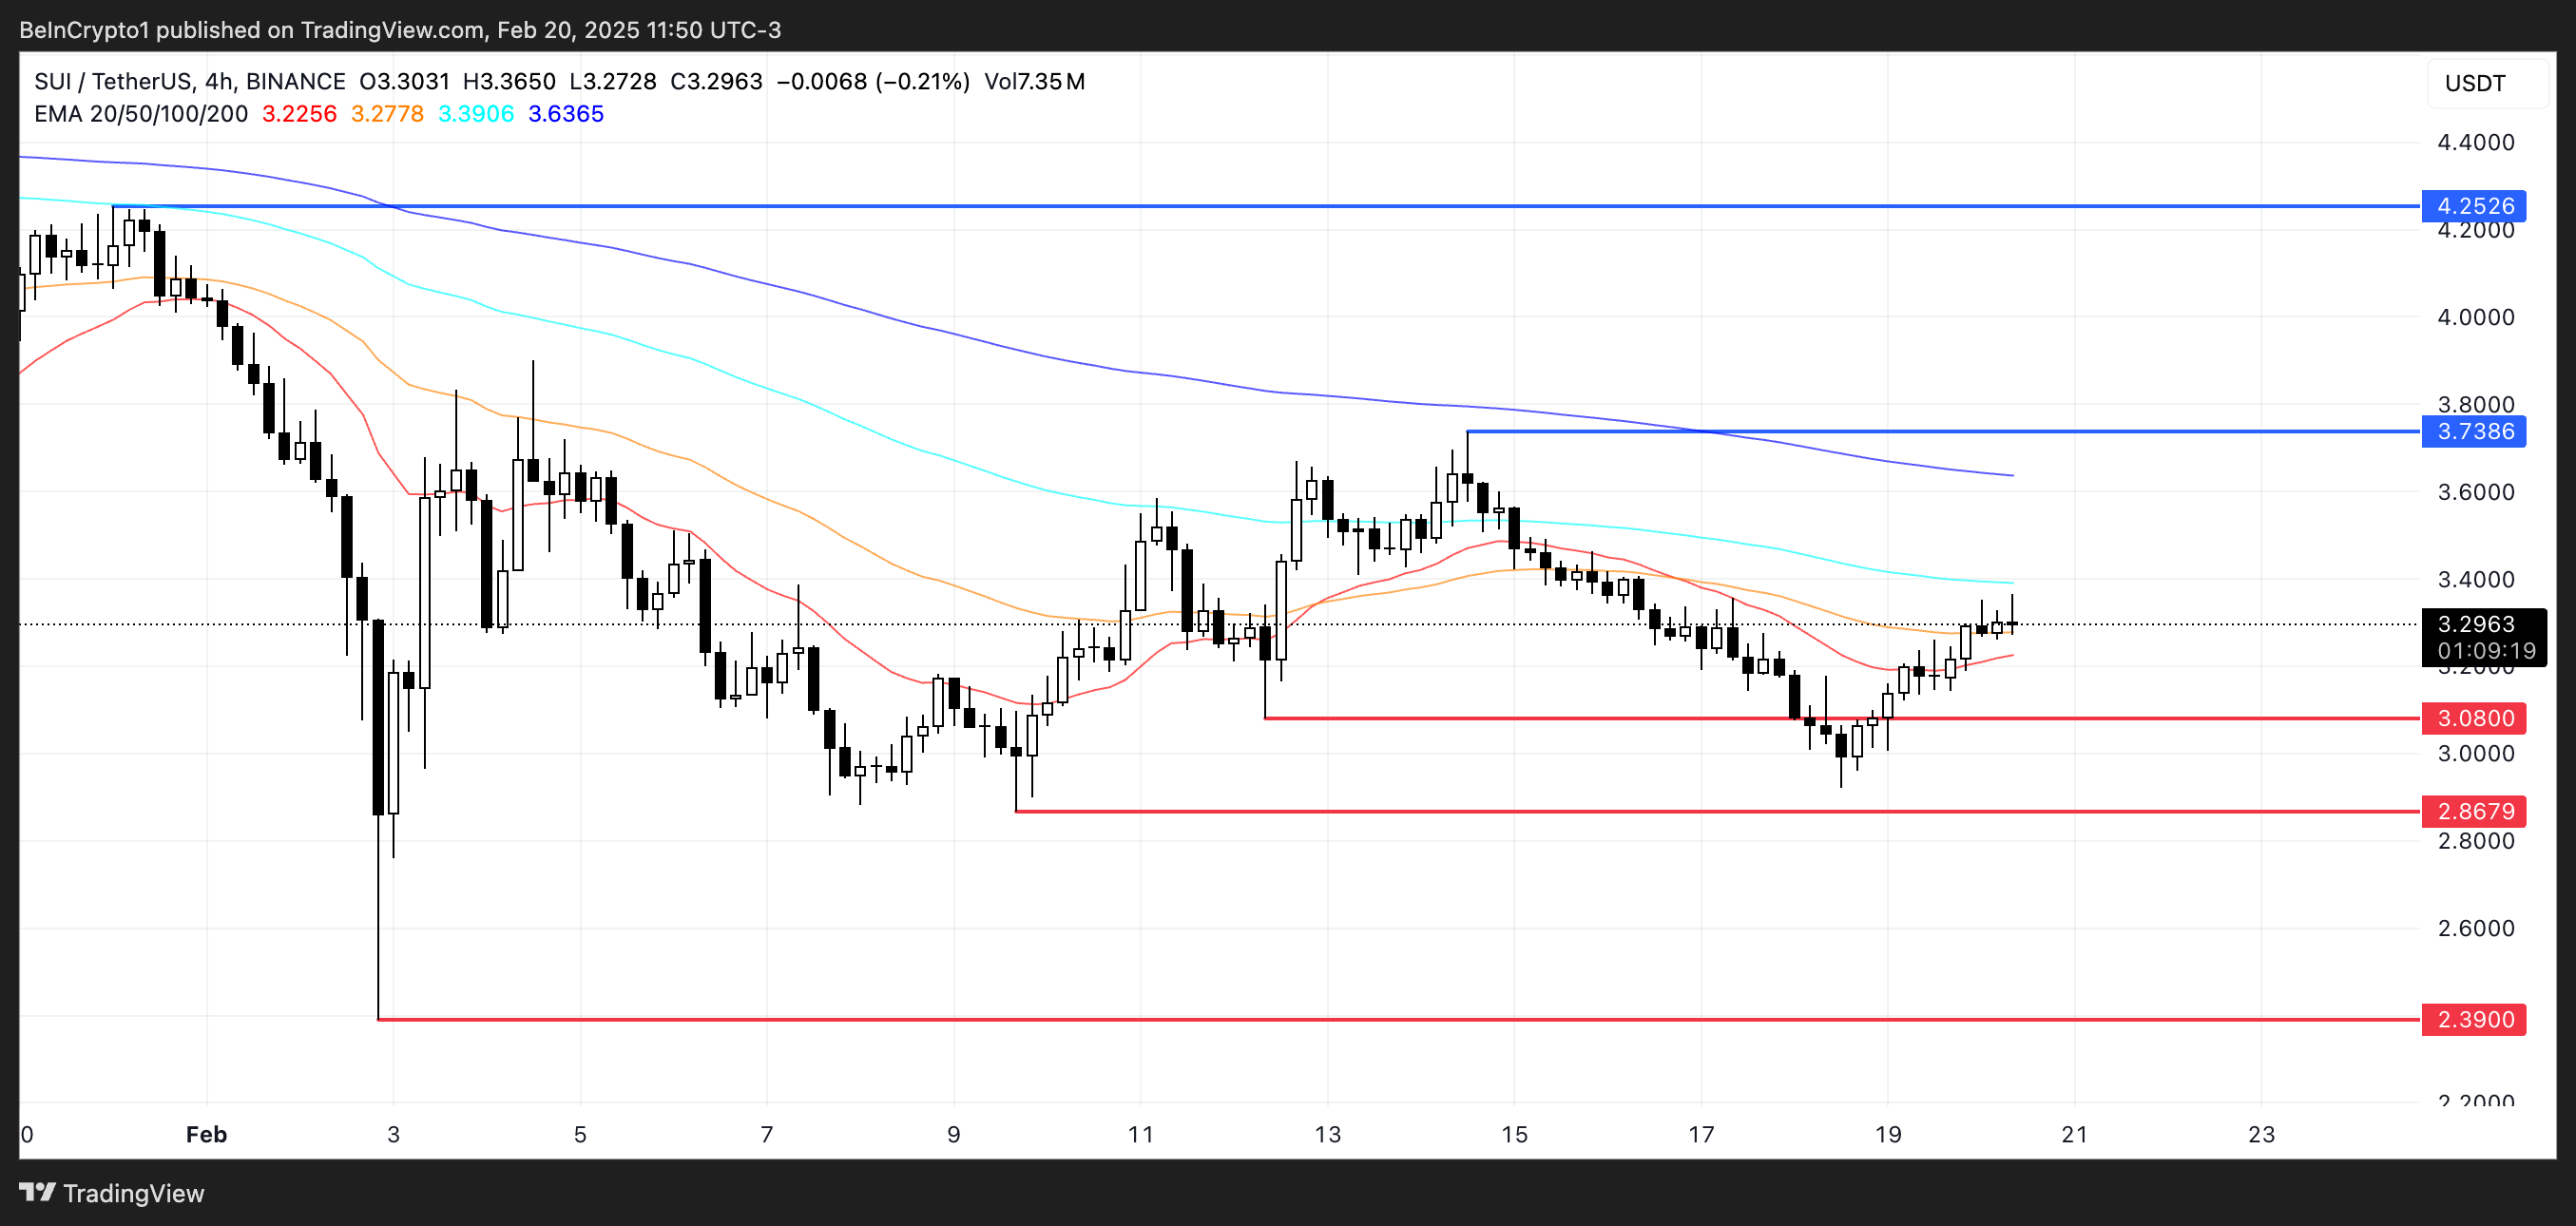
Should it break through this level, SUI could continue rising until $4.25, marking a significant breakout above $4 for the first time since the end of January. This bullish crossover would likely attract more buying interest, confirming a reversal of the bearish trend.
On the other hand, if the upward momentum fades and the short-term EMAs fail to cross above the long-term ones, the bearish trend may continue. In this scenario, SUI could retest support zones around $3.08 and $2.86.
If these levels are breached, SUI could decline further, potentially dropping as low as $2.39.
Disclaimer
In line with the Trust Project guidelines, this price analysis article is for informational purposes only and should not be considered financial or investment advice. BeInCrypto is committed to accurate, unbiased reporting, but market conditions are subject to change without notice. Always conduct your own research and consult with a professional before making any financial decisions. Please note that our Terms and Conditions, Privacy Policy, and Disclaimers have been updated.


 Arabic
 Chinese (Simplified)
 Dutch
Dutch English
 French
 German
 Italian
 Portuguese
 Russian
 Spanish
